A picture is worth a thousand words. Today, the best picture for power outages in the United States is a combination of state-level indications (see the top-left figure) with drill-downs to county-level indications (see the bottom-right figure). Note that these screen captures were taken from Gridmetrics’ new product, the Power Outage Notifications System (PENS), at 12:15 P.M. MT on August 12, 2021. The figures show a collection of widespread power outages affecting many counties in Michigan.
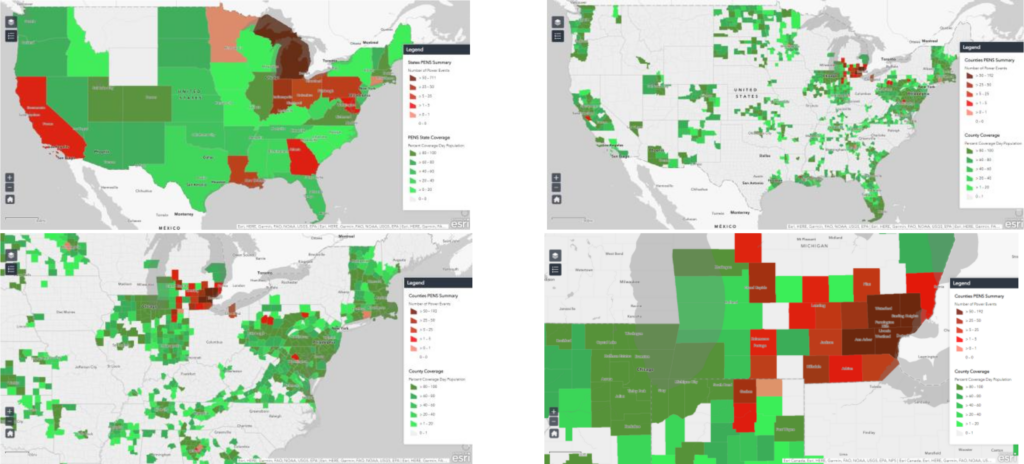
Public safety personnel and emergency responders use maps like these to make critical decisions to deploy resources and serve the needs of our communities. Unfortunately, today, these high-level images are typical of the best available holistic view of power status in the United States. In them, it’s evident that power is out in multiple counties around Detroit, but exactly where is the power out? And what caused these power outages?
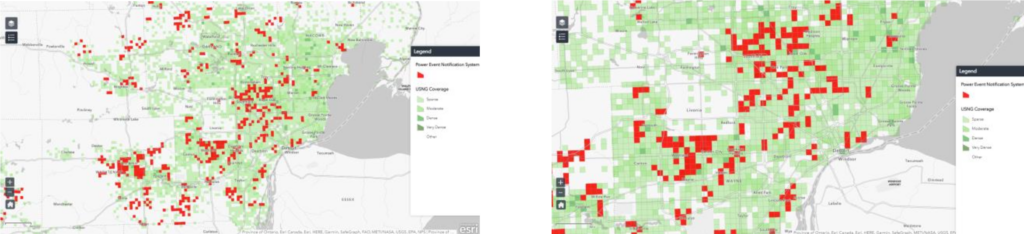
PENS goes a step further. In the images below, PENS drills down into the counties to provide a hyper-local view of where power is out. Each red and green cell represents a 1 km × 1 km cell and is uniquely identified in the U.S. National Grid (USNG) projection system. Further, these maps are updated every five minutes, providing a near- real-time view of the state of power in neighborhoods and communities. PENS enables our public safety teams and emergency response organizations to make better decisions, often during our fellow citizens’ time of greatest need. This is the power of PENS.
PENS Power Source
Gridmetrics has spent the past several years developing PENS. The “secret sauce” is the ability to leverage a network of sensors that already exist on the last miles of the electric distribution grid. Today, 150 million people— 45 percent of the U.S. population—live or work within one kilometer of an existing Gridmetrics sensor.
Gridmetrics partners with communications companies to extract power data from the primary network’s aggregation equipment, delivering the bits and bytes over the first miles of the access networks. Consider 5G small cells, community Wi-Fi hotspots and broadband fiber nodes. These have two things in common: 1) private, secure fiber backhaul, and 2) resilient, battery-backed power. By aggregating the data from nearly 300,000 of these devices, Gridmetrics creates the most comprehensive, independent, observational view of the state of power in the last miles of the electric grid. And it does this every five minutes.
Gridmetrics maps these sensors to USNG cells. Some cells have a single sensor, whereas other have more than twenty. By virtue of the locations of the communications infrastructure, PENS aligns well with the density and distribution of people. PENS analyzes the sensor data in space and time to identify power events, categorizing them by magnitude, duration, and impact. It’s not about any one sensor or even one USNG cell. It’s about many sensors, and it’s about identifying events as clusters of USNG cells that highlight the areas of interest for our PENS customers.
The Right First Market
There are many use cases for the PENS product suite. With PENS’s real-time, hyper-local insights, utilities can be immediately notified when the power is out—and often just as valuably, when power is restored. In addition, PENS can benefit numerous markets, including insurance, business resilience, real estate, corporate security and smart cities. However, no market is more important (and in need of PENS) than public safety and emergency response.
PENS was developed specifically to address these market needs. The strength of PENS comes from putting power events in context. As such, PENS is ideally suited to be a layer in an existing geographic information system (GIS) dashboard or decision support tool. Gridmetrics partnered with Esri, the world’s leading GIS platform, to enable fast, simple and easy integration by providing a PENS Feature Service in the Esri ArcGIS Marketplace. PENS can also be supplied via email alerts or an API.
A PENS-powered dashboard showing power outages overlaid with nursing homes, senior centers, retirement communities, day-care facilities or critical infrastructure directs attention to power-vulnerable populations in their time of need. PENS is certainly important in times of disasters, but it doesn’t take a hurricane to create relevance. Just this past month, the northwest was under an extended heat dome. Hundreds of people died. How many could have been saved with hyper-local, real-time visibility into the intersection of power outages and power- vulnerable people?
PENS enables public safety responses to shift from reactive to proactive, which can save lives. The power of PENS stems from the ability to place real-time, hyper-local power outage data into the hands of public safety and emergency response organizations and help them make better decisions.
If you’re a public safety officer, an emergency response manager or otherwise responsible for citizens’ well-being, visit the Esri ArcGIS Marketplace and click the “21-Days Trial” button to experience the power of PENS.