 | Vol 1., No. 4 April 19, 2023 Scott Clearwater, Gridmetrics, Inc.® s.clearwater-c@gridmetrics.io |
In finance there is understandably a great deal of concern and effort put into understanding the risks involved with a certain portfolio. “Tail risk” is a term that describes the losses that can occur at extreme values of components of the portfolio. In the world of power metrology one analog to financial portfolio risk is the risk associated with large variations in voltage. In finance “Value-at-Risk” becomes “Voltage-at-Risk” and “Expected Dollar Shortfall” becomes “Expected Voltage Shortfall(or Surplus).” Such measures are another useful tool in characterizing and comparing different jurisdictions in terms of the risk with respect to their reference voltage. Higher risks means lower service quality in terms of its effect on business resilience, lifestyle as well as accelerated damage to equipment. A direct consequence of a wider tail in service quality is more customer complaints and that is what, in part, drives an organization to employ remedies, either voluntarily or as a result of increased regulation. This final point is true in finance as well as other organizations like energy providers. Thus understanding tail-risk is an important consideration in being able to mitigate the effects of extreme events.
To make an analogy to the financial version of VaR and Expected Shortfall, for a given percentile, say 1%, the VaR at 1% is how much the portfolio would lose on such a day. Expected Shortfall at that same 1% level is the average of all losses from the 1% level on down to the worst possible day—a complete portfolio wipeout, or in terms of voltages, a complete blackout.
The power grid version of tail-risk metrics relies solely on the historical relative voltages (voltage divided by a reference voltage) from one or more sensors which form the “portfolio.” The Voltage-at-Risk (VaR) is simply the relative voltage at a particular percentile of the historical relative voltages. For example, VaR(1%) is one minus the portfolio’s relative voltage at the 1st percentile level over some time period. So if the relative voltage at the 1% level is 0.9 then VaR = 0.1 = 10%. Similarly, the Expected Voltage Shortfall (EVS) or Excess (EVE) for a collection of sensors is the average relative voltage below the Shortfall threshold or above the Surplus threshold, both expressed as a percentile of the relative voltage distribution over some time range. Unlike in finance an expected [voltage] surplus is a bad thing!
In practice, as mentioned above, the voltage risk is always measured with respect to the reference voltage of a sensor. Thus, the further the deviation from 0 for a given threshold, the greater the value of VaR(x%) or EVS(x%) or EVE(x%). Ideally, voltages would always be exactly on their reference value and VaR = EVS = EVE = 0, meaning no shortfall and no excess and so no risk. Any deviations from zero indicate imperfect performance. Large deviations (limited to 100% on the upside) indicate significant tail-risk of the voltage supply. Increases in VaR and EVS and EVE over time indicate a rise in risk to the voltages on the grid being considered.
As an example of these notions we consider a number of metropolitan areas where Gridmetrics has significant coverage and compare EVS and EVE in 2021 and 2022. To understand the charts in Fig. 1 consider the case of Houston in 2021 which shows that the average voltage for the worst 1% of days in 2021 was more than 20% below the nominal value. This indicates a large number of outages in 2021 for Houston. By contrast Miami was only about 4% below nominal voltage for the worst 1% of days. Looking further into Fig. 1 we can see that in 2022 Boston had the smallest expected shortfall tail-risk (EVS) while Phoenix (2022) had by far a staggering tail-risk. Overall, 2022 was a much worse year than 2021 by this measure as seen by the vertical scale.
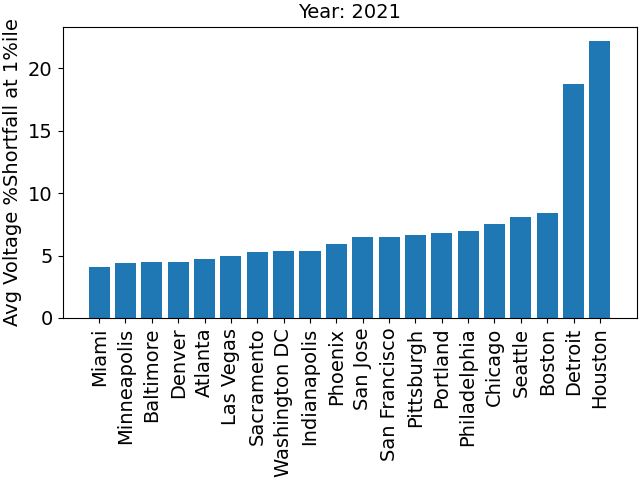 | 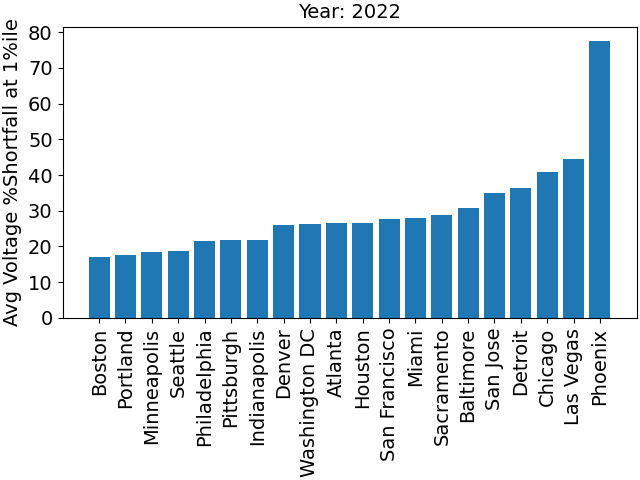 |
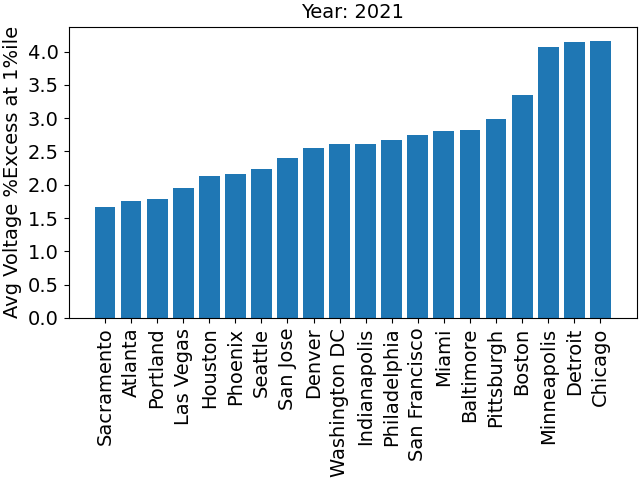
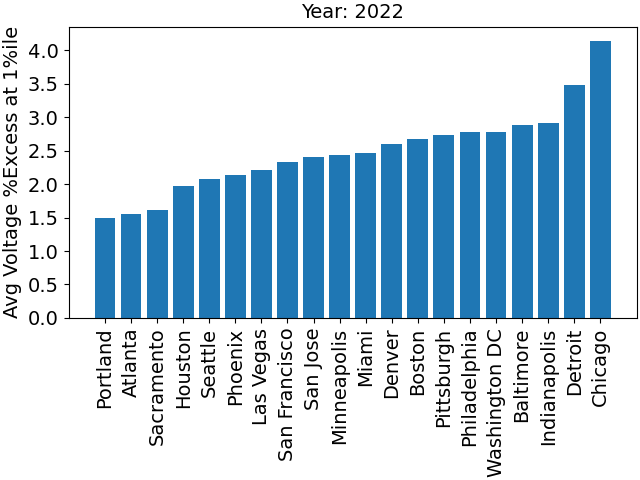
Fig. 2 is the same as Fig. 1 but for Expected Voltage Excess at the 1% upper tail of the voltage distribution. In Fig. 2 we see that Atlanta, Sacramento, and Portland had the smallest EVE risk in both 2021 and 2022 while Chicago and Detroit had the largest EVE risk. Note that Detroit appears as one of the worst tail-risk metros in both the shortfall and excess, indicating very poor overall tail-risk management.
 |  |
Both these tail-risk measures, EVS and EVE, are important metrics for understanding the implications of large excursions from nominality which could be useful for utilities and regulatory agencies for allocating resources to manage these damaging shortfalls and excesses.
Learn more about Gridmetrics actionable power intelligence solutions.