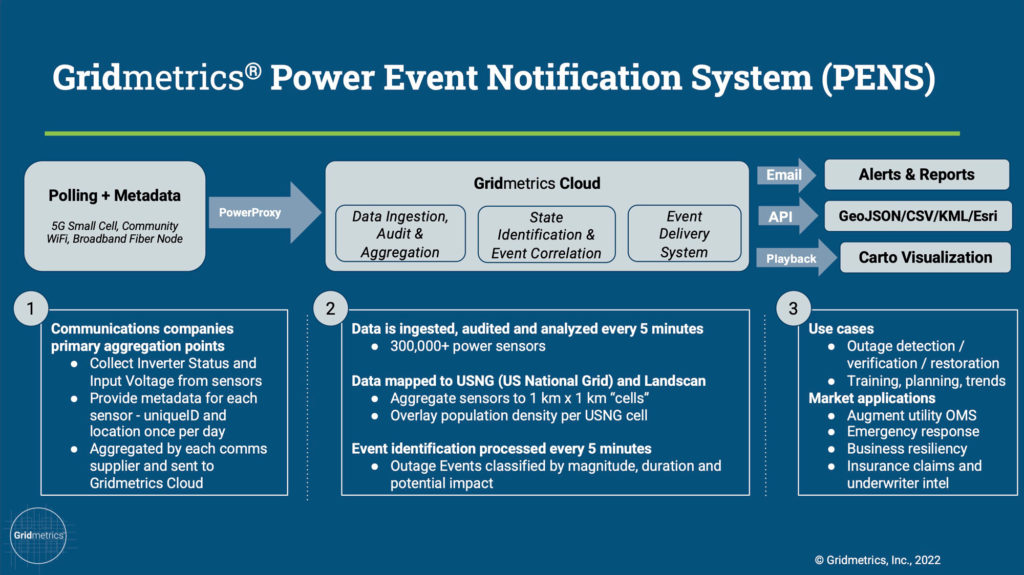
Gridmetrics can help the DOE ensure the nation’s grid is secure and resilient to disruptions by providing live and historical data on everyday power quality.
This data can be used to identify areas where the grid needs to be strengthened in order to withstand natural stressors, such as heat, cold, wind, and flooding.
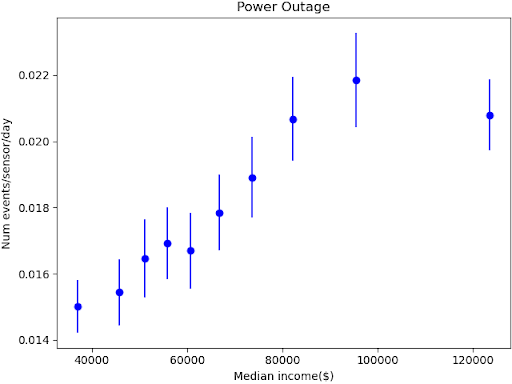
Another aspect of DOE’s mission is to promote energy equity. Gridmetrics’ data can contribute to this initiative by providing and analyzing different geographical regions to see to what extent there exist differences of power resilience for different income levels and racial/ethnic groups.
Cyber attacks on critical energy infrastructure may include efforts to mask the attack in order to thwart timely detection, fault location, and remediation.
Grid Metrics can provide independent, out-of-band, and battery-backed insight into the actual power conditions, which is essential to appropriate detection and restoration following attack.
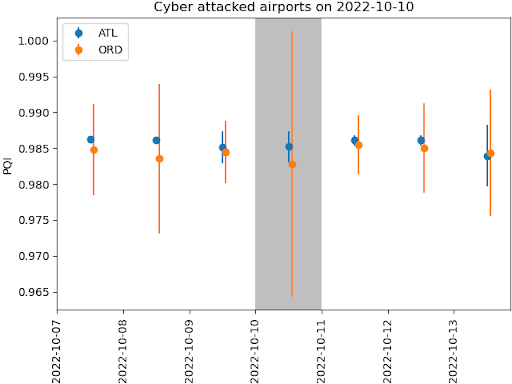
For example, the chart to the right shows the daily Power Quality Index for Atlanta Hartsfield (ATL, 32 sensors) and Chicago O’Hare (ORD, 53 sensors) airports, plus or minus three days from the 2022-10-10 cyberattack.
The sensors used were within 10 miles of the airport latitude and longitude given by a Google search of the airport. Although this attack appears to be confined to a denial-of-service attack, we can nevertheless see if there are any additional insights from Gridmetrics’ datasets. One unusual feature which stands out is the level of fluctuations at ORD on the day of the attack. There appeared to be no unusual weather during that day, so a signal like this could be worthy of further investigation. More refined data looking at power quality down to the five-minute level might reveal further insights whether this is due to a “normal” power anomaly or possible mischief.
Gridmetrics reports are available down to the 5-minute level and thus provide a near real-time view of power outages during extreme weather events. This capability can provide FEMA with precise locations where emergency resources are needed.
An application of Gridmetrics historical data can be used in planning and recommending where critical resources might be susceptible to power outages and other power-related anomalies.
Similar to FEMA’s use case, state-level emergency management services can use Gridmetrics near real-time data to allocate resources where they are most needed during an emergency. Also, Gridmetrics historical data can be used in planning and approval processes so that housing and businesses are able to operate properly.
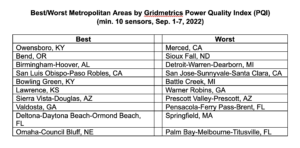
Again, similar to FEMA’s use case, local governments can use Gridmetrics for immediate response actions as well as planning. This table shows the best and worst metropolitan areas in the US for the month of September 2022. These results could extend to any timeframe and restricted to a particular state.
There are many diverse business applications to Gridmetrics data and customized reports. Such tailored reports enable decision-makers to consider a more comprehensive assessment of a critical aspect to their business heretofore unavailable.
 Until now real estate agents have not been able to provide prospective clients with accurate information about the electrical power in the area.
With more people working from home, this information is more relevant than ever to residential buyers.
On the commercial side, agents who can provide this information will better aid their client’s decision-making process.
A critical aspect of insurance underwriting is knowing the risks involved. Gridmetrics power resilience metrics provide insurance companies with a means of assessing the risk involved with business disruption due to outages, as well as from other voltages events such sags, surges, and fluctuations.
Another critical aspect of the insurance business is fraud detection. Gridmetrics data can be used as a check if power disruption actually occurred at the time and place made by a claimant.
When a business has plans for a new office or facility, it needs to be confident that the power in the area is reliable and stable. Gridmetrics has the historical data to show which regions are best suited to high-quality electrical power needed for business continuity.
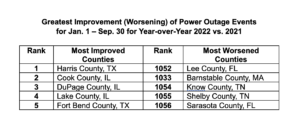
One way of assessing this is to do historical comparisons to see which areas have improved or worsened over selected time periods an example of which is show in Table 2. Harris County, TX had a big improvement from 2022 to 2021 because of the big freeze event in Houston in 2021.
Currently power utilities lack the capability to rapidly access their own grids at the distribution level (low voltage, i.e., household voltage). Partnering with Gridmetrics, utilities can combine their higher-voltage data to see what is happening in the “last mile” of their networks.
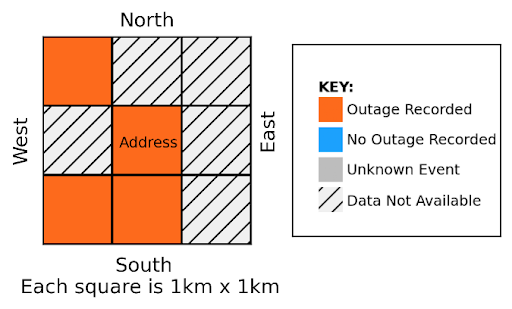
This specifically allows for detection of safety-critical fault conditions, such as distributed energy resources backfeeding the distribution network during a power outage.
Financial firms involved with making business loans currently have no way of assessing the risk due to power resilience issues, including both outages and voltage levels and fluctuations. Businesses in areas with poor power resilience are more prone to business disruption and this factor could be included in any loan terms, including the interest rate to be paid to the firm.
Hedge funds and other financial entities involved in portfolio balancing can now include power intelligence data in positioning their capital. Companies with facilities that lie in regions with poorer power resilience are more prone to business disruptions and therefore more likely miss business metric targets.
For example, the power resilience of the facilities of two companies can be compared and used as a factor in allocating funds. Additionally, Gridmetrics data allows traders to access “Power-at-Risk” and its impact on a business. This kind of tail-risk of power at almost any level of geographical resolution will become more important as the 20th century grid evolves into the 21sr century smart-grid.