 | Vol 1., No. 1 February 16, 2023 Scott Clearwater, Gridmetrics, Inc.® s.clearwater-c@gridmetrics.io |
In this article I will discuss a possible missing arbitrage opportunity in pricing utility stocks. The essential idea is that hedge funds, other speculators, risk managers, and insurance underwriters do not have timely power resilience data and therefore cannot respond quickly to very high numbers of power events that affect utility profitability. By power events I mean outright power outages, voltage sags and surges. This is because no one has near real-time power data at the street level. That was true until Gridmetrics came on the scene with more than three hundred thousand sensors throughout the continental United States. Now that this data is available never before considered opportunities exist for monetizing this data.
To see how this could work in practice we consider the Houston, Texas metropolitan area where Gridmetrics has a high sensor penetration with over 97% of Harris County (where Houston is located) covered. Also, Houston is known for weather extremes of hot and cold as well as major storms all of which make it an interesting opportunity area for arbitraging. Finally, the local utility, CenterPoint Energy, Inc. (NYSE:CNP) has almost its entire service area located in the Houston area.
The arbitrage we are talking about here is that Gridmetrics power resilience data yields deeper insights into a utility’s performance than has been heretofore available. For example, outright power outages have the effect of lower revenue as well as increased maintenance costs. More subtly, prolonged power sags and surges have deleterious effects on appliances and equipment, either by damaging them or shortening their useful life. All these effects make it less desirable from a customer standpoint to do business in such an area, which, again, would reduce the utility’s revenue.
Gridmetrics has a number of power event categories that make it convenient to analyze power resilience changes as well as some proprietary indexes that provide additional insight. In this article we will focus on events Power Outage, Under Voltage (more than 6% below the reference voltage), and Over Voltage (more than 6% over the reference voltage). We will also look at the Power Quality Index, PQI, which is a proprietary non-linear function of voltage relative to each sensor’s reference voltage.
In this analysis we want to focus on CenterPoint’s (CNP) movement independent of the general movement of utility companies. To achieve this, we use the Utilities Select Sector SPDR® Fund (NYSEARCA:XLU) as a proxy for the utility industry. Thus, what we are tracking is the ratio of the relative daily changes in CNP performance to the relative daily changes in XLU. In this case we are using closing daily values, although this analysis could be calculated down to the five-minute interval.
Black Swan Arbitrage—Late to the Party?
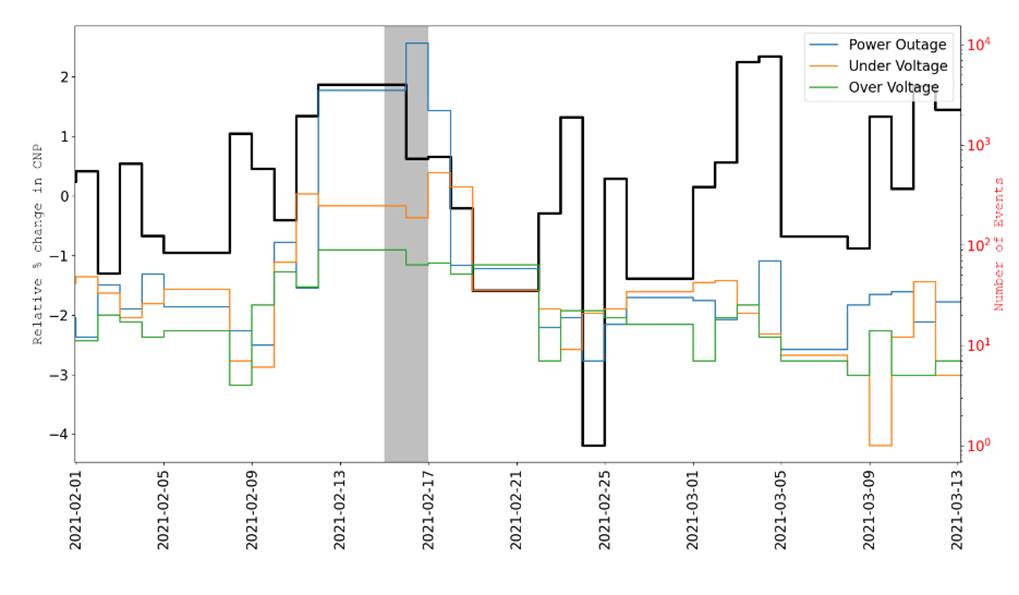
In the figure below we show the relative change in CNP and the number of events identified by Gridmetrics. The gray area corresponds to the major freeze event that occurred in February 2021. Note the large spike in the blue trace (Power Outages) that occurred during the freeze—and the lack of a response in the relative CNP price until almost a week later.
Gray Swan Arbitrage—There’s a Party?
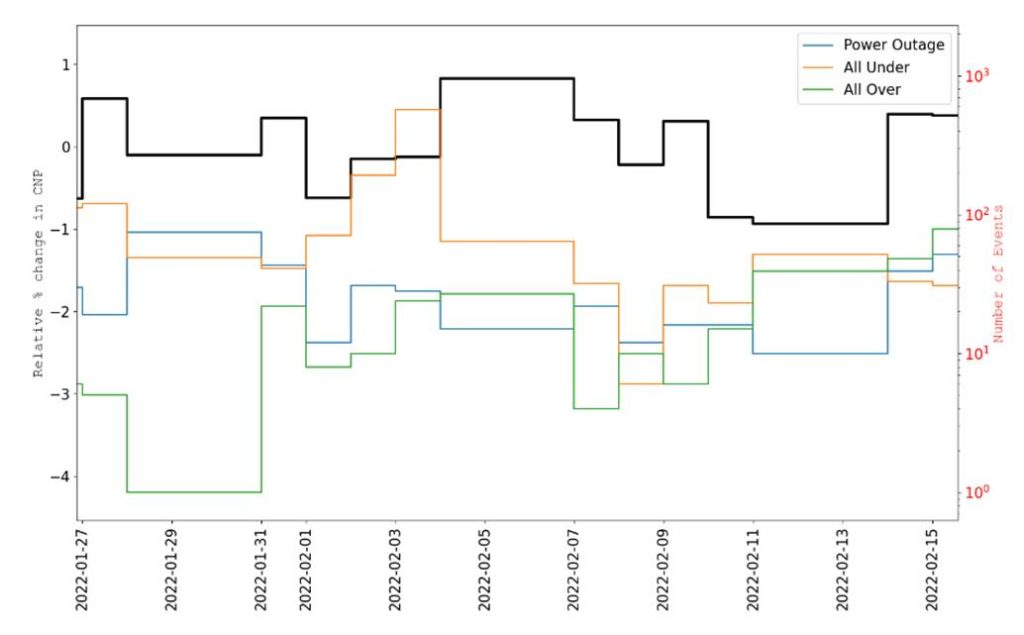
In the second figure, note the large increase in Under Voltage events on 2022-02-04 and no response in the stock price. This indicates that despite the relatively poor performance that day, there was no corresponding effect on the stock price. Perhaps the event was not large enough or long enough, but it is possible to track longer-term effects that can indicate systematic issues with power delivery.
Overall, there is almost no correlation between relative CNP stock price and the number of power events over the test period of 2021 through November 2022.
We Missed the Party!
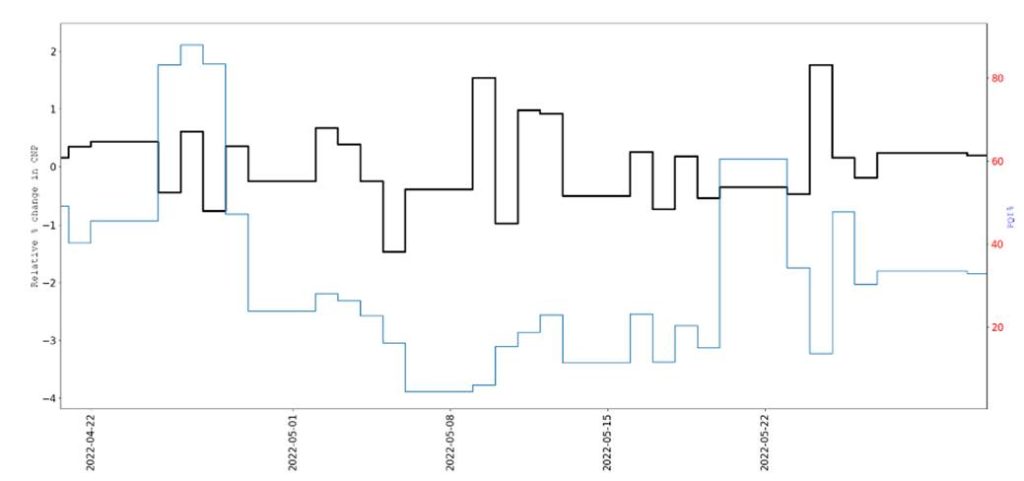
Finally, we look at the Power Quality Index, PQI, in this case the percentile of values. In the figure below we see that even though the PQI percentile changes dramatically, the relative price changes do not track it.
Up to this point, we have focused on the stock market implications of power resilience arbitrage. However, other arbitrage opportunities exist, namely, in the area of insurance where underwriters could generate superior risk-adjusted premium schedules based on this data. While this short blog is not meant to be an exhaustive treatment of power resilience arbitrage it shows the potential for many possible interesting applications.
In the coming weeks I will continue to explore new opportunities to utilize the actionable power intelligence of Gridmetrics data in business, government (through cyber-security and power equality), and whatever else I can think of!
Learn more about Gridmetrics actionable power intelligence solutions.